This month, I’m going to wrap up discussion of network troubleshooting tools. So far, I’ve covered netstat, tcpdump, and ngrep and sniff. This month, I’ll discuss Ethereal, a tool for browsing network traffic interactively and analyzing network traffic. To put it more emphatically, Ethereal is the all-singing, all-dancing, packet-inspecting tool that all admins should have in their software toolboxes.
Ethereal is capable of capturing packets for analysis or reading saved packet captures in a number of common formats. Ethereal support libpcap/tcpdump, Sun’s snoop/atmsnoop, LanAlyzer, MS Network Monitor, HPUX nettl, AIX iptrace, Cisco Secure IDS, and a number of others. (The full list can be found in the FAQ.) Ethereal supports more than 530 network protocols. You can also see supported protocols by selecting “Supported Protocols” from Ethereals Help menu.
The Ethereal Interface

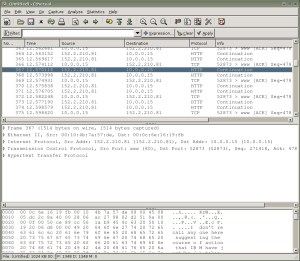
I’ll start off by taking a look at Ethereal’s interface. Ethereal has a 3-pane interface that shows the user a great deal of information in an easy-to-use interface. The first pane shown gives a summary of captured packets (see Figure 1), displaying the packet number, its source and destination, protocol, and information about the packet. The middle pane gives detailed information about a selected packet, and the bottom pane displays the packet itself in a hexdump style. Note that you can edit the columns in the second pane using Ethereal’s Preferences dialog, found under the Edit menu.
A particularly spiffy feature of Ethereal is that it will highlight each part of the packet when you click on the information in the middle pane. For example, let’s say you capture some traffic between your desktop and a Web site, as you’re requesting a Web page. In the first pane, you click on the packet containing a GET request. This displays that packet in the second and third panes. Then, you can click on a particular bit of information contained in that packet in the second window — like the packet’s source — and it will highlight the section of the packet that contains that information in the third window.
Of course, you need some captured packet data to display. The Ethereal Web site features some interesting sample captures. They also have several capture formats so users can test Ethereal’s multi-format capabilities.
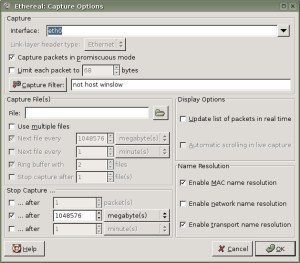
Even if you don’t have much in the way of interesting traffic, it’s a good idea to familiarize yourself with Ethereal’s packet-capturing capabilities. The CTRL+k hotkey will bring up the Capture Options window ( Figure 2), or you can select “Start” from the Capture menu.
Here you can choose the interface on which you want to capture packets, set a filter for the packet capture, and so forth. If you only want to use Ethereal to analyze packets, you can use tcpdump (or a number of other tools, but tcpdump is my preferred choice…) to capture packets and display them with Ethereal.
Filters

When capturing data with Ethereal or tethereal, you will probably want to filter out some or most packets and concentrate on the interesting packets. You can do this by creating one or more filters. The filter language, pcap, is the same as the one used by tcpdump.
You can save a number of filters, but you can only apply one filter at a time to a capture.
Ethereal also uses display filters, to sort through captured packets, but these filters do not alter the saved traffic. The syntax for display filters is different from the syntax for capturing packets, so be sure to read the Ethereal help page to get the syntax for filtering displayed packets.
Statistics

Ethereal has some really nice statistical tools, each available from the Statistics menu. Want to see a summary of your captured packets? Ethereal provides a summary that includes the length of the capture, format, elapsed time between packets, average bytes per second, and so forth.
That’s just the tip of the iceberg, though. Ethereal can generate throughput graphs, give statistics on “conversations” that are present in captures, show the protocol hierarchy statistics, and very much more.
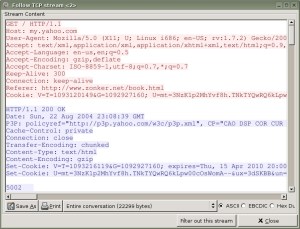
One of my favorite Ethereal features is the capability to follow a TCP stream. Ethereal basically creates a readable representation of a “conversation” contained in your packet capture. Ever had trouble convincing someone that they shouldn’t be sending passwords over unencrypted connections, like telnet or FTP? Just do a quick packet capture and use Ethereal to show them how easy it is to pick up that kind of thing.
To get this, just select “Follow TCP Stream” under the Analyze menu ( Figure 3).
Getting Ethereal
Of course, I’ve only scraped the surface of Ethereal’s features in this column.
The Ethereal Web site has source code and precompiled packages for Red Hat/Fedora, Solaris, and Windows. Debian users can grab Ethereal/tethereal with apt-get, and there are usually packages available for just about any *nix system if you don’t feel like compiling from source.
Next topic: Rootkits
That’s it for network tools, at least for a little while. Next month, I’m going to start talking about another topic that’s not so near-and-dear to those of us administering public-facing Linux systems — rootkits and other tools to compromise systems.
Specifically, I’d like to cover some of the rootkits that are in known usage right now, ways to detect or prevent their use, and general hints on how to scan for rootkits if you suspect your system may have been compromised. In that vein, I encourage readers to send in any tips or tricks that they’ve run across when dealing with rootkits and other nasties. While I’ve had dubious pleasure of encountering a few of these little afflictions, I’m sure that my readers have also some interesting and useful experience to share.
Until then, enjoy using Ethereal!
This was a post originally written for and published on the now-defunct UnixReview.com. Rescued from the dustbin via Archive.org.